Perhaps, so far, you have mostly seen concrete instances of graphs. But often in graph and network theory, we want to look at graphs in a more general way, that is, as representatives of a larger class of graphs. This is why we often deal with random graphs.
But what is a random graph? How would you come up with a random way of creating a graph? How would you define a class of generic graphs of which a concrete graph is an instantiation?
The mathematicians Paul Erdös (1913-1996) and Alfred Renyi (1921-1970) came up with a model that is now known as the Erdos-Renyi model. It provides a way of framing a class of graphs as a random variable where each concrete example is associated with a probability.
In the ER model, we start with a fixed number of nodes \(n\). In a complete graph of this size, there are \(n(n-1)\) edges.
Apart from a fixed node count, we have a fixed edge count of \(m\). An ER graph is just a representative of this class, where each edge has the same probability of being present.
To construct an Erdos-Renyi graph, randomly draw \(m\) edges without replacement from the set of all possible edges in a graph of \(n\) nodes.
The model as a whole is written as \(G(n, m)\).
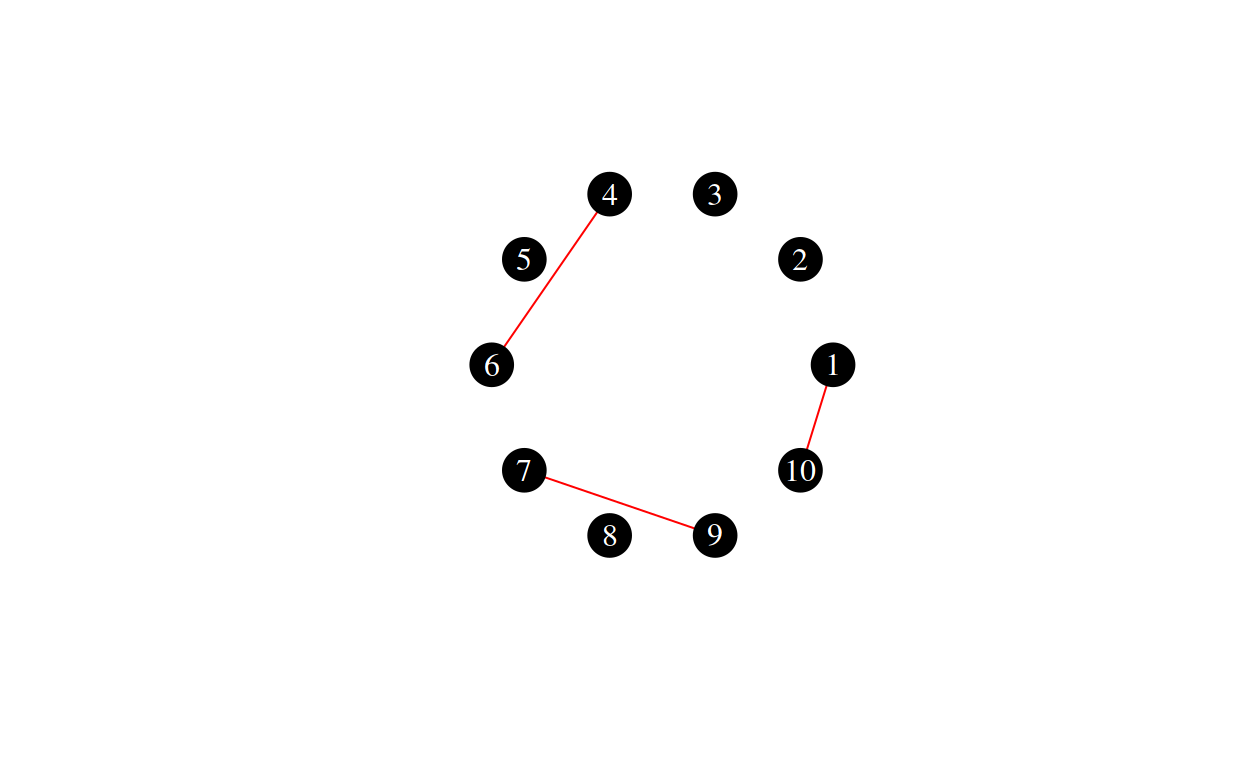
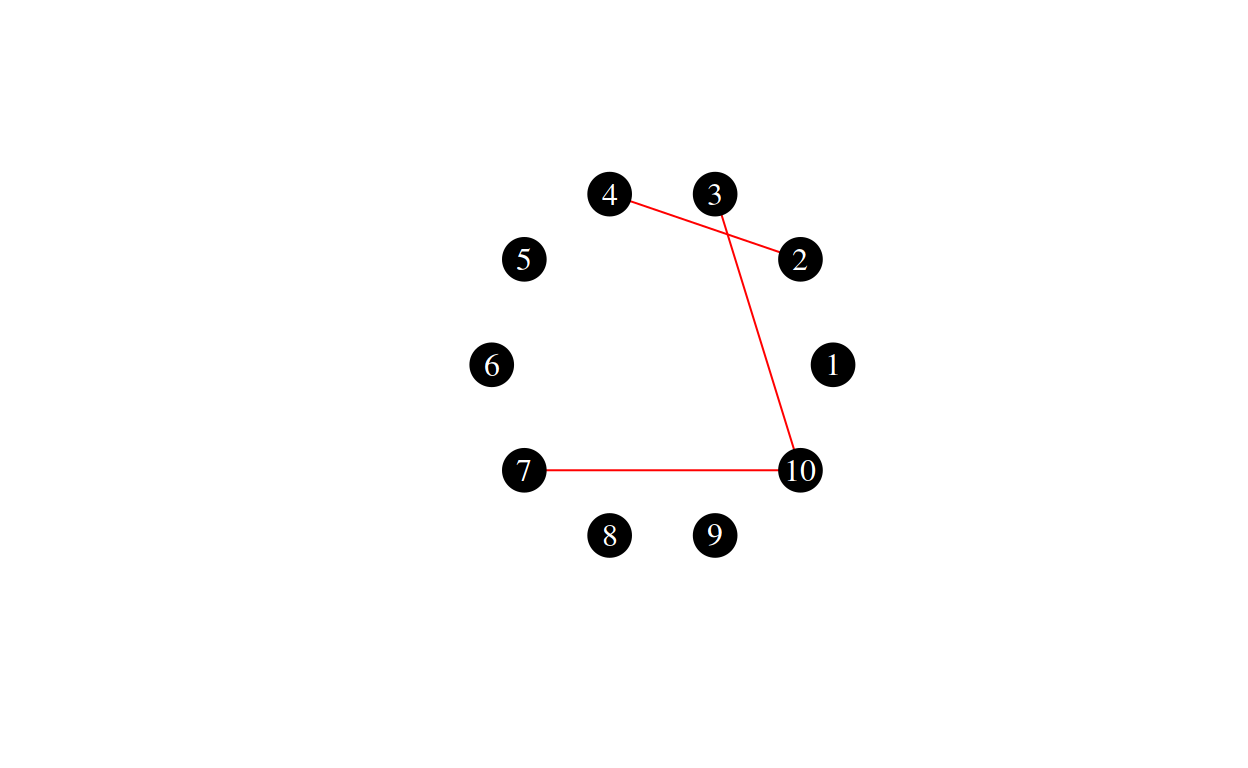
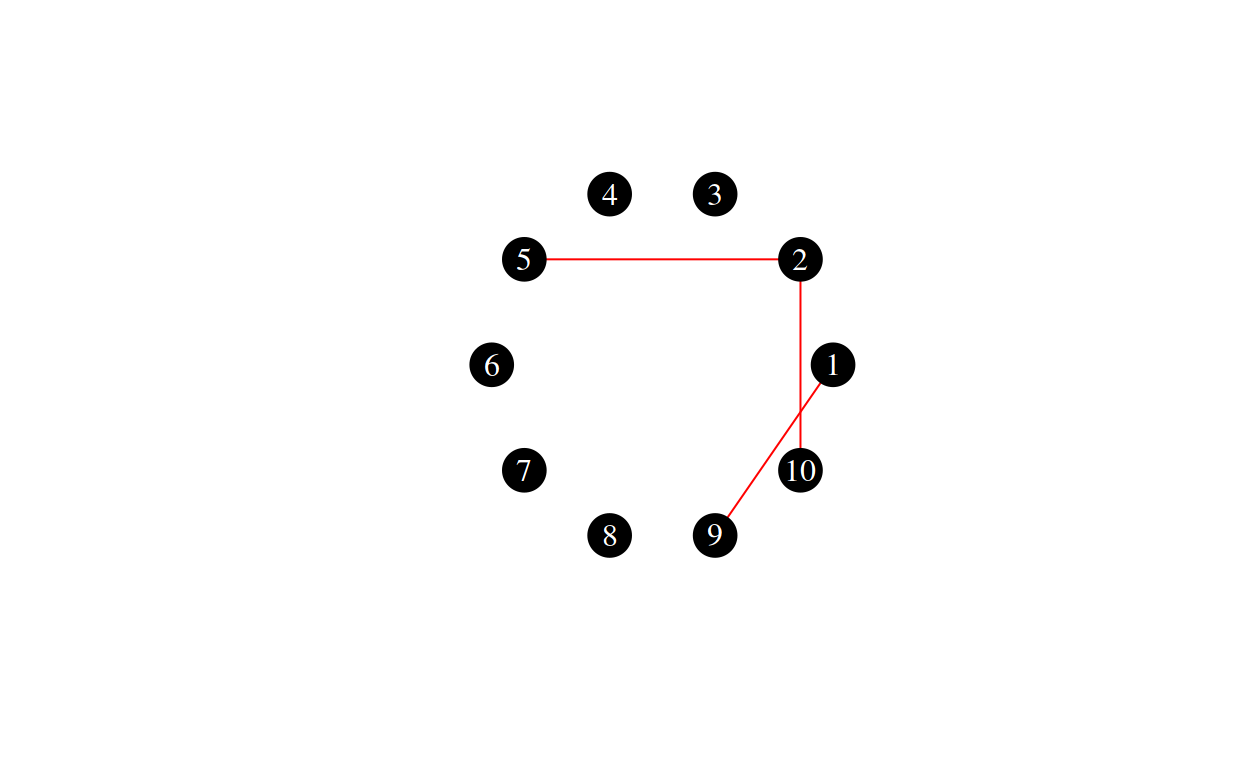
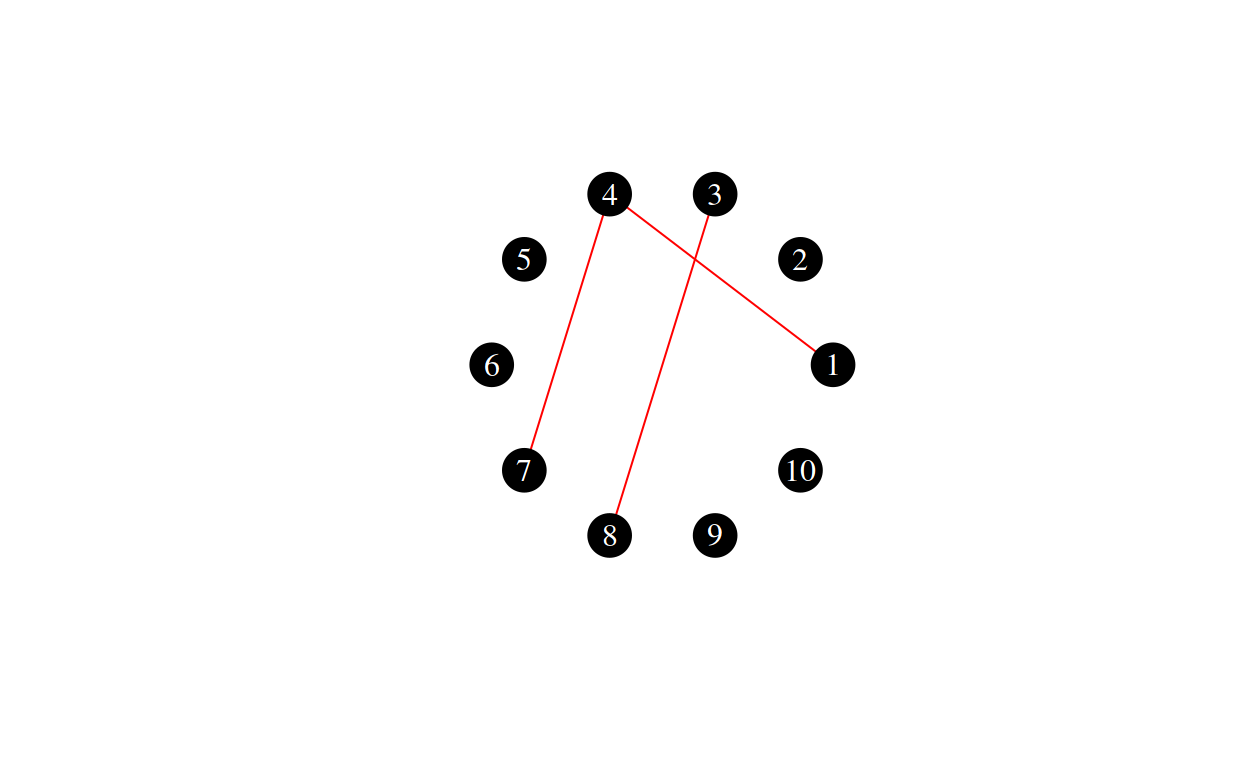
Here are some random draws from \(G(10, 3)\):
The Erdos-Renyi-Gilbert Model
There is a slight variation on this model by Edgar Gilbert (1923-2013). Instead of fixing the exact number of edges \(m\), we define a probability \(p\) which indicates the probability for the presence of each edge.
This means that when constructing an instance of this class of graphs, we iterate over all possible edges in a graph of node count \(n\) and add each edge with probability \(p\).
The way to write this model formally is \(G(n, p)\).
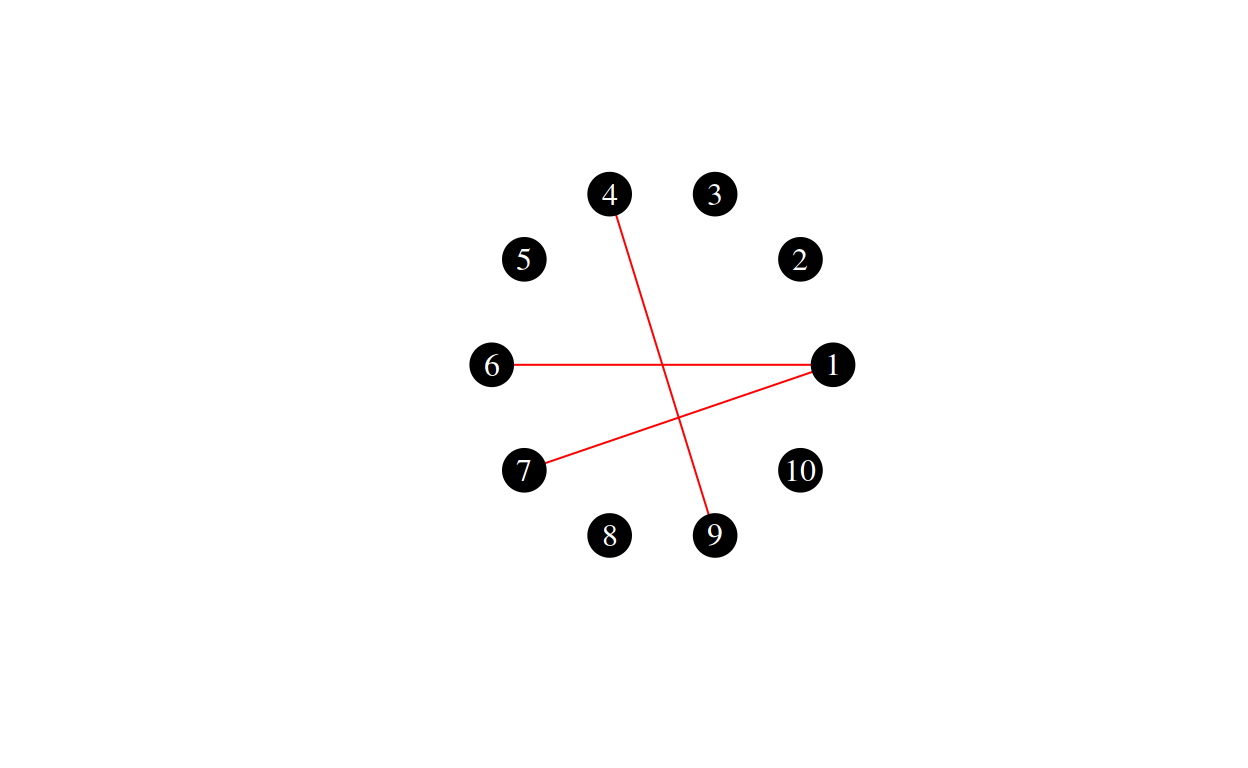
Here are three examples of \(G(10, 0.033)\)

As you can easily see, the classes \(G(n, m)\) and \(G(n, p)\) are not equivalent. Technically, the complete graph \(G(N, E)\) with \(|N| = n\) and \(|E| = n(n-1)\) is a representative of \(G(10, 0.033)\) because it is theoretically possible to draw each edge. It is just highly unlikely. Conversely, the complete graph is obviously not part of \(G(10, 3)\) because it does not have \(3\), but \(10 \cdot 9 = 90\) edges.
What can we use this model for?
There are several things to note about this model.
First of all, what could you say about the density of that graph? If you create a sufficient number of random graphs this way, the average network density will be very close to \(p\).
There is another way of setting up the model. Start with a fixed number of nodes. Now take a fixed number of edges smaller or equal the number of possible edges. Put a random edge into the network until you have as many edges as you chose.
This way of setting up the network has the advantage that you can control the network density precisely. Every graph set up this way will have the same network density.