To learn the basics of graph theory, you need nothing more than pen and paper. However, once you move on to more complex analyses, you will need a computer. Graphs are so fundamental to such a diverse range of tasks, that virtually every programming language has a library that provides tools to create and analyze graphs.
Here, we will have a quick look into Graphs.jl (Fairbanks et al. 2021), a Julia library for graphs.
If you have never worked with Julia before, we would recommend that you learn the basics of Julia first. [TODO: write basic julia tutorial]
To install the library, simply call:
using Pkg
Pkg.add("Graphs")
Pkg.add("GraphPlots")
Pkg.add("Compose")
Pkg.add("GraphRecipes")
Pkg.add("Plots")
To load the library in your script, execute the following:
using GraphsThe using keyword brings the everything that the Graphs library exports into your global scope.
Now that you have Graphs.jl installed and loaded, we can start working with it. Let’s begin by creating a simple graph and plotting:
g = SimpleGraph(5)

add_edge!(g, 1, 2)
add_edge!(g, 3, 4)
add_edge!(g, 2, 4)
add_edge!(g, 1, 5)
add_edge!(g, 2, 5)
add_edge!(g, 4, 5)
This first simple snippet of Julia code already tells us a lot. First, incidentally, this is how we usually set up a Julia workflow in a script. You load the libraries at the top of the script and then move on to perform the task that the script is supposed to perform. In this case, we first constructed an empty undirected graph with 5 nodes (g = SimpleGraph(5)). Empty in this case means that the graph has no edges.
Then we proceeded to add six edges to the graph (e.g., add_edge!(g, 1, 2) for “add an edge to g from node 1 to node 2”). The ! is a Julia convention for functions that manipulate an object in-place. It is important to keep this in mind. Here, it means that by simply calling the function, we modify the object g without having to assign it again.
Let’s see whether everything went as planned:
using Plots, GraphRecipes
graphplot(g, curves = false, names = collect(1:nv(g)), markersize = 0.2)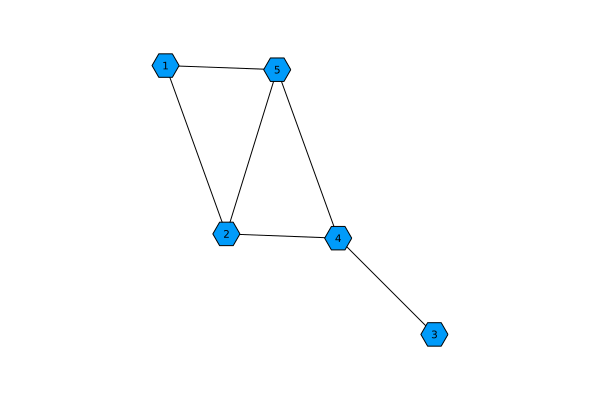
Task
Check if you can verify whether the graph in the plot is the correct visualization for the graph that we created before.