One of the earliest agent-based models was devised in 1971 by Thomas Schelling (Schelling 1971). It pioneered many of the paradigms that constitute agent-based modeling today. As you will see, this model is very reminiscent of the 2D cellular automata that we looked at before, but the “cells” are explicitly anthropomorphized, bridging the gap to thinking about them as agents. In Conway’s Life, you saw that the update rules were loosely metaphorical for social phenomena (“survivals”, “births”, “deaths”, “isolation”, “overpopulation”, etc.). We may never know how much inspiration Schelling took from the contemporary movement of hobbyists analyzing Conway’s Life, but the time was ripe for the paradigm of agent-based modeling.
Schelling’s model addressed the phenomenon of ethnic segregation in urban areas. In the 1970s, when this paper was published, residential segregation between people of different ethnicities was very pronounced in the US and efforts to alleviate this problem were slow. Schelling’s model of segregation assumes agents with very simple behavior to leverage some insights into why segregation proved so difficult to reverse.
The Constituents of the Model
The Schelling model is constituted by three general components1: agents, an environment, and rules according to which agents interact with each other and with the environment. We will go through the model components one by one to develop an intuitive understanding of agent-based models and how they are built.
The Environment
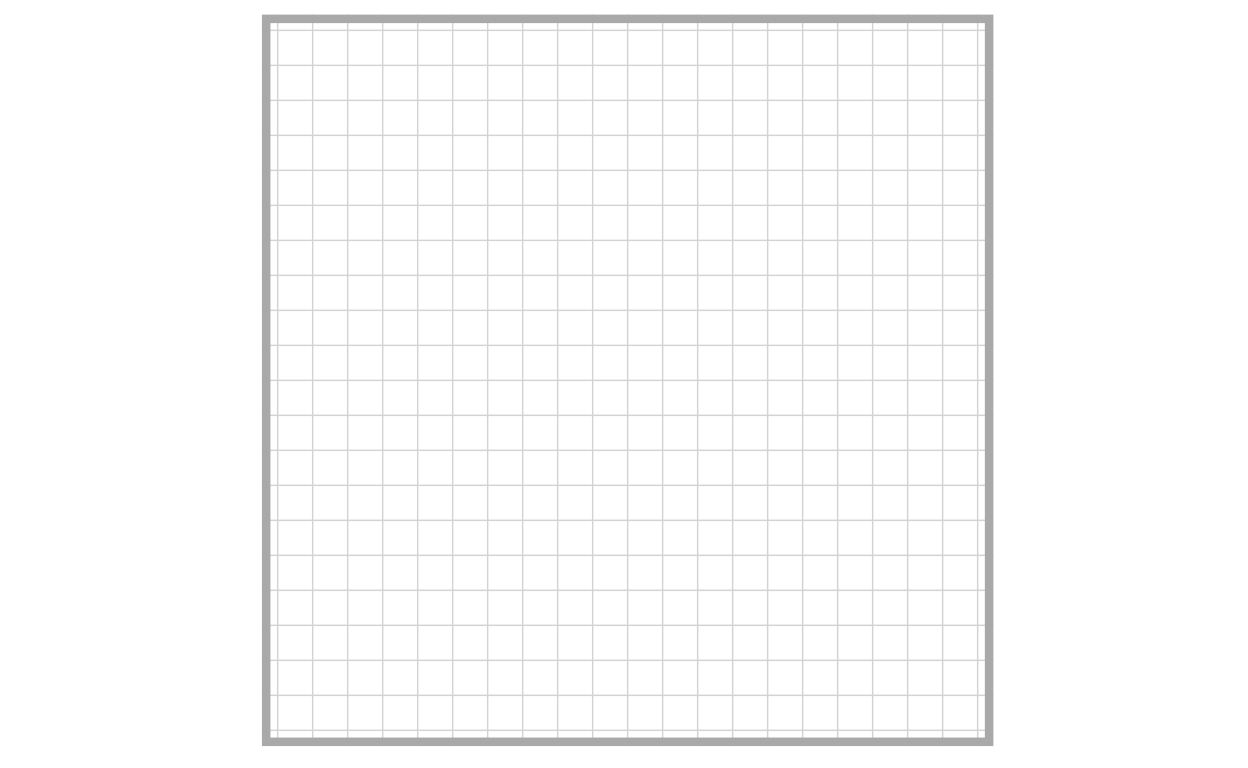
Let’s start with the environment of the Schelling model. The environment is the “arena” in which the agents interact with one another. In the Schelling model, we use a square grid, just like the one that we used in Conway’s Life:
There are many more options when choosing how to represent an environment in your model, though. For instance, you can put your agents on a graph and let them move around over its edges, you can create a continuous plane where agents move around in two dimensions, or you could even create virtual 3D worlds with a physics engine. The choice of environment depends heavily on the objective of the model. In the case of the Schelling model, the grid represents urban areas in the US “closely enough”. A good general rule of thumb is to make the model as simple as possible to retain its explanatory power2.
Agents
The most important unit of an agent-based model are, of course, the agents. The agents are the individuals that interact in the arena that we set up with our environment. In the simplest configuration of the Schelling model, we have two different kinds of agents that we distribute randomly across the grid, leaving a certain percentage of cells empty so that the agents can move around. Let’s call the two agent types blue and orange agents.
Update Rule or Stepping Function
The update rules define how agents interact with one another and with the environment. As we measure “time” in agent-based models as discrete time steps, update rules are sometimes referred to as stepping functions or step functions. In the Schelling model, the update rules are very simple:
- First, we set a global tolerance level which indicates, how many agents of the other kind an agent is willing to tolerate in its neighborhood.
- Then, we check for each agent whether the number of agents of the other kind in its neighborhood3 exceeds the tolerance level that we set globally for the model.
- All agents for which the tolerance level is exceeded relocate to a random free position on the grid.
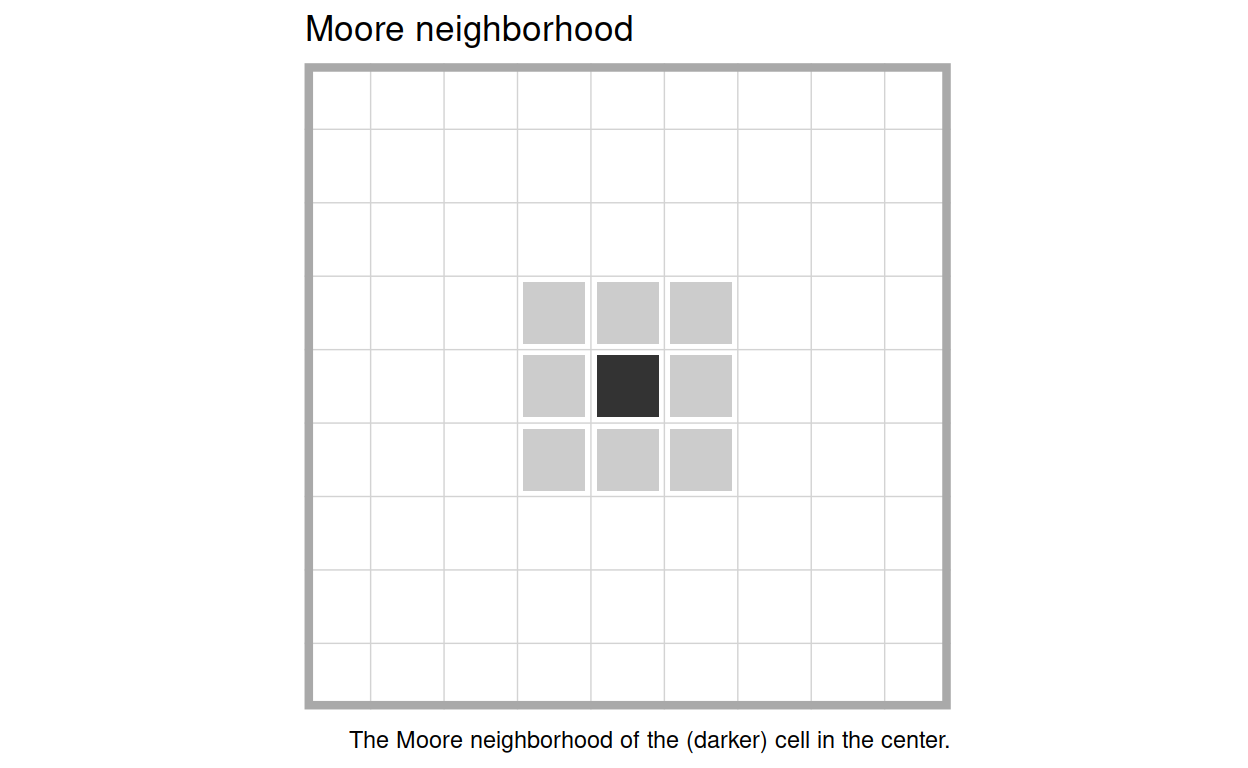
Note that we define an agent’s neighborhood as its Moore neighborhood.
Running the Model
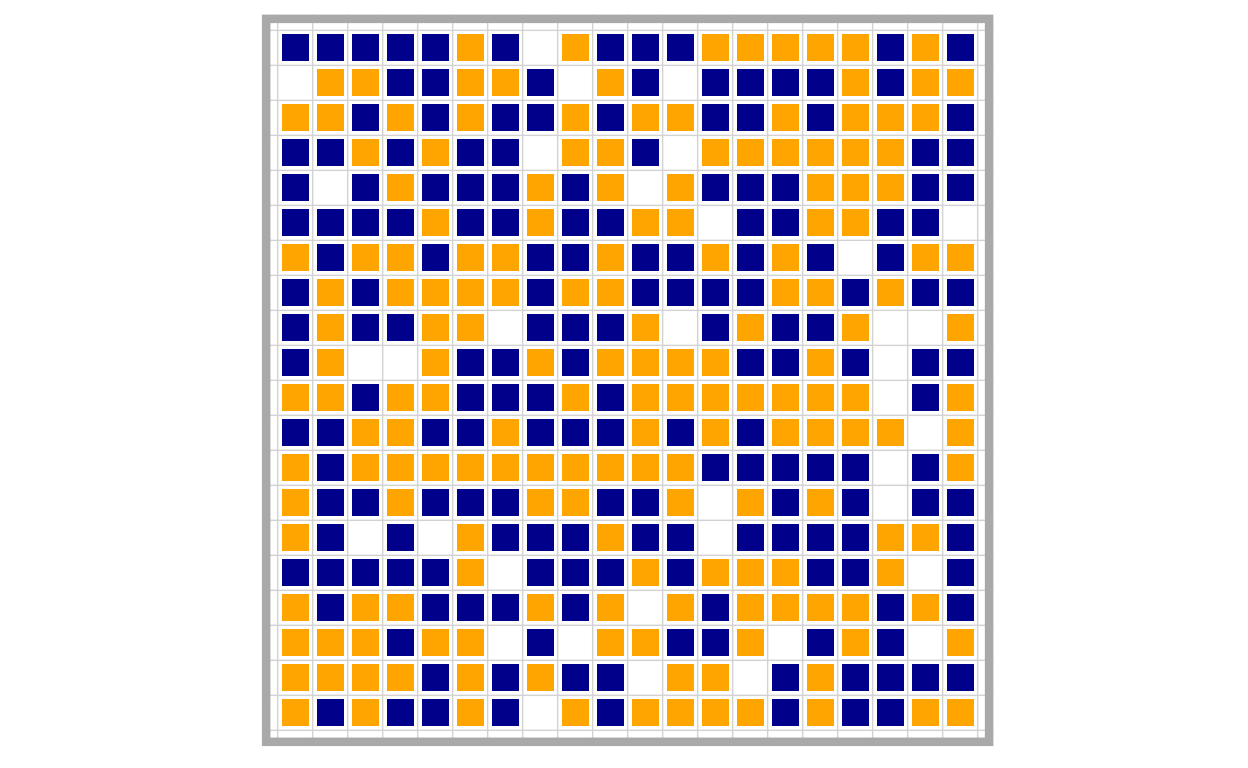
Let’s look at a simple example of how this model plays out over time. We randomly distribute blue and orange agents in equal proportion over the grid, leaving 10 % of the cells free. The tolerance level is set to 4, meaning that each agent will relocate if it has more than 3 neighbors that are not of its own kind.
Having a tolerance for up to 4 out of 8 neighbors of the other kind doesn’t sound that intolerant. One might assume that all the agents are willing to live in completely mixed neighborhoods, constituted of approximately 50 % agents of each kind. This is not what happens, though:
As you can see, the agents quickly for homogeneous clusters of blue and orange agents and the agents on the fringes of those clusters keep moving around frantically. We can even observe this effect (although slightly weaker) when agents are willing to live in a neighborhood with a majority of agents of the other kind. This is how the model turns out for \(tolerance = 5\)
Even with seemingly high tolerance levels, agents cluster into areas of alike agents which mimics the phenomenon of ethnic segregation that Schelling and his contemporaries were trying to solve. This is the main finding from this model, but by far not the only one. There are several parameters that we can manipulate to systematically analyze how this system behaves. However, before we move on to analyze this model systematically, it is first important to get a feel of what it means to manipulate a system parameter in an agent-based model.
Task
There is a free implementation of Schelling’s model (Wilensky 1997) in the NetLogo (Wilensky 1999) library. Open it and play around with the parameters. Can you observe some general tendencies when you manipulate the tolerance parameter?
Alternatively to NetLogo, you can use the gridabm
framework for R which was
also used to generate the animations and plots for this article.
Manipulating the Tolerance Parameter
[TODO: write/edit]
In the example above, we already saw that with a tolerance level of \(3\), the segregation into clusters of alike agents. What would you expect to happen for higher or lower tolerance thresholds?
As are all agent-based models, more or less (Epstein and Axtell 1996).↩︎
That applies not only to the model environment, but to all components of the model.↩︎
I.e., blue if an agent is orange and vice versa.↩︎